"C# Basics (Retired)" was retired on June 30, 2019.

- Python Courses
- Intermediate
About this Course
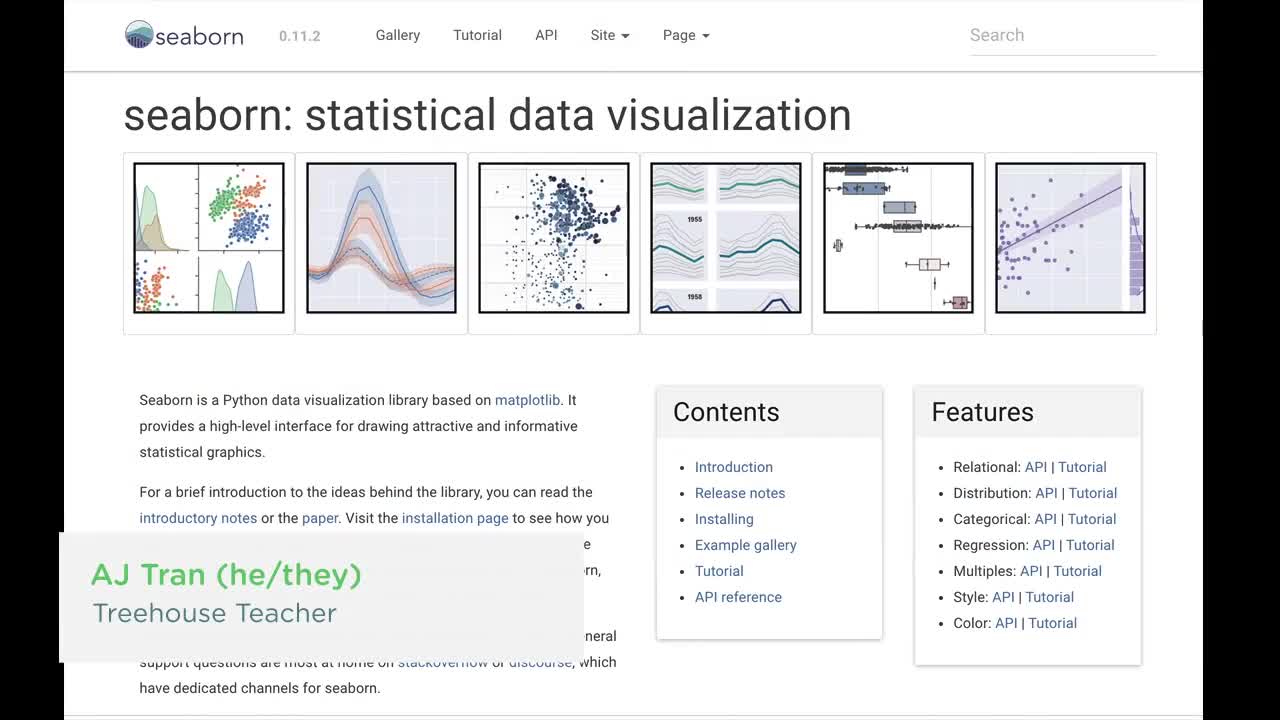
The Seaborn module is a Python visualization library based on Matplotlib. It provides a higher-level, more convenient way to create common statistical plots and is well-suited for labeling and presenting statistical graphics. This course will help you get started with Seaborn by walking through the structure of its library, showing how to create key charts in Seaborn, and comparing the results with equivalent plots created with Matplotlib.
What you'll learn
- Create charts with Python using Seaborn
Teacher
-
AJ Tran
AJ is an instructor who truly believes that new skills offer people the chance to remake their lives.
Through code, AJ was able to transition from the restaurant industry to the Tech industry.
Now, AJ is happy to help people from all around the world learn coding skills at Treehouse!